W.I.S.D.O.M. (Wallets Indicate Someone Did Our Market Research)
Preface
This strategy was developed as our submission for the University of North Carolina Undergraduate Alpha Competition in April 2026. The instructions were to take on the role of Carolina Quant Partners (CQP), a mid-sized asset manager that runs systematic U.S. equity strategies. The prompt asked us to develop a new product, with transparent, rules-based characteristics that avoided black-box machine learning. Additionally, it was requested that the strategy solely trade US equities, and if possible, behave defensively in volatile markets while still capturing most long-run equity premium.
Special thanks to my collaborators, Sean Helaili, Jinghan He, and Yogee Samal for their contributions to this project, and to the judges from CenterBook Partners, Horizon Investments, and the UNC Kenan-Flagler Business School for awarding us first prize.
Introduction
Many recent headlines and academic reports on prediction markets have posed the same question: do some traders appear to have information before the public does? One widely reported example involved a Polymarket user who earned more than $400,000 after betting on Nicolás Maduro’s capture shortly before the event occurred. A second example came from the Iran conflict, where anonymous Polymarket accounts placed suspiciously well-timed bets ahead of U.S.-led strikes on Iran.
Such well-timed bets are the primary reason why we are proposing a strategy that identifies behaviors of specific prediction market participants rather than the general crowd. To study whether actions of successful traders can serve as signals of future price moves, we develop wallet-level trader profiles, and develop a strategy using participant-level dynamics as forecasting input.
Literature Review
Prediction markets are still a relatively new area of research, but the literature already shows that betting market prices can aggregate dispersed information and sometimes outperform traditional forecasting methods. Prediction market prices can be efficient predictors because they summarize available information in real time instead of quarterly or annually (as shown in Wolfers and Zitzewitz's 2004 paper).
A Federal Reserve working paper also recently demonstrated that prediction markets perform on par with, and occasionally better than the traditional forecasting methods that central banks and financial institutions have relied on for decades. Among these methods are surveys, professional forecasts, and model-based benchmarks.
While betting markets have been shown to be a successful information aggregation structure, the exact mechanism by which private information is incorporated into the price remains poorly understood. Foundational work on this topic includes a paper by Bossaerts et al. that shows prediction market traders who move prices in the right direction are also the ones who profit most, suggesting their activity genuinely reflects private information rather than noise.
Data Methodology
The data was collected from the Polymarket blockchain using a blockchain indexer that converts raw on-chain activity into a queryable database format. The indexer scans, parses, and organizes blockchain events so they can be searched efficiently with SQL rather than extracted manually via graph querying.
The key fields available include raw trade history, wallet-level trade history, time-window trade queries, large-trade filters, point-in-time market prices, full price paths, wallet positions, consensus paths, and wallet behavioral profiles. All metrics are computed as point-in-time relative to the timestamp of the latest change in profile data, ensuring no data leakage.
Signal Pre-Processing
Polymarket hosts a wide array of betting markets, many of which are unrelated to finance or economics. While Polymarket makes an effort to categorize markets into buckets such as Finance, Sports, and Politics on their official API, this field is blank across a large fraction of all historical markets. To resolve this, we utilized a DeepSeek language model to fill in missing values and sort the questions into relevant groupings. Similarly, the Claude Haiku model was used to assign a ticker to each question regarding a financial matter involving a publicly traded company.
Market ID | Category | Ticker | Question |
5459097 | Financial | AAPL | Will Apple beat earnings in Q4? |
1282437 | Financial | AAPL | Will Apple miss earnings in Q4? |
1298420 | Political | N/A | Bondi no longer AG by April 1? |
Financial questions were then analyzed according to their directional sentiment. Since questions can have opposing meanings–for instance, “Will Apple beat earnings” versus “Will Apple miss earnings?”––a directional score (+1, 0,-1) was assigned using the FinBERT Foundation Model. First, we restated the questions into statements, for example, converting “Will Apple beat earnings” into “The market expects Apple to beat earnings”. FinBERT, pre-trained on a corpus of financial documents, then classifies each statement as positive, neutral, or negative for the future outlook of the given company. To ensure that prices reflect a consistent signal regardless of phrasing, the data was normalized as follows:
This normalization centers the signal to zero, where positive values represent bullish sentiment and negative values represent bearish outlook.
Question | Price | New Price | Direction | Direction Score |
Will Apple beat earnings in Q4? | 0.75 | .25 | Positive | 1 |
Will Apple miss earnings in Q4? | 0.25 | .25 | Negative | -1 |
Additionally, we computed each trader's mean return per trade (in percent), the Sharpe ratio of returns, and the significance of their returns. We assumed the theoretical mean was represented by the point-in-time trader-wise mean return across all Polymarket participants.
Wallet ID | Mean Return / Trade | Sharpe | Return T-stat |
3487988 | -0.78% | 0.012 | -2.45 |
2433567 | 5.6% | 1.20 | +3.056 |
6568898 | 0.5% | 0.5 | +0.045 |
Signal
In simple terms, our signal is the market’s sentiment toward a given company adjusted for any trading activity displayed by traders with high returns that has not yet been mirrored by those with poorer performance. We call this gap between views the “wedge.”
To obtain a signal on a certain ticker, we take a given market discussing the affairs of that company, and compute its sentiment-adjusted price. Next, we classify the participants of this market into skill buckets based on the t-statistic of their past returns. Traders with many trades resulting in positive returns rank highly, while traders with strictly positive returns but only a handful of trades are ranked more modestly. The same holds for the different types of unskilled traders, with those who have many losing trades occupying the lowest rankings.
Lastly, we compute the consensus price held by traders in the top and bottom third of participants, then calculate an average between this value and the overall market consensus.
We repeat this process for every market discussing a given ticker at the current timestamp, then aggregate up to the ticker level via a participant-weighted average (the more traders in a market, the higher the weight). We opted to aggregate using the number of participants over dollar volume to prevent a small number of large trades from skewing the results.
Portfolio Construction
The portfolio is constructed using a systematic ranking and filtering process based on the composite signals. Stocks with active signals are ranked from highest to lowest, with the top 25% of the distribution designated for the long bucket and the bottom 25% for the short bucket. To ensure directional integrity, a secondary filter is applied: any stocks in the long bucket with a negative signal, or stocks in the short bucket with a positive signal, are removed to prevent contradictory positions.
The portfolio undergoes a weekly rebalancing process. During each rebalance, the dataset is updated with the most recent week's trade history and new market questions to capture shifting sentiment and identify emerging or expiring signals. We then equally weight the selected stocks within long and short buckets, resulting in a dollar-neutral portfolio.
Performance and Analysis
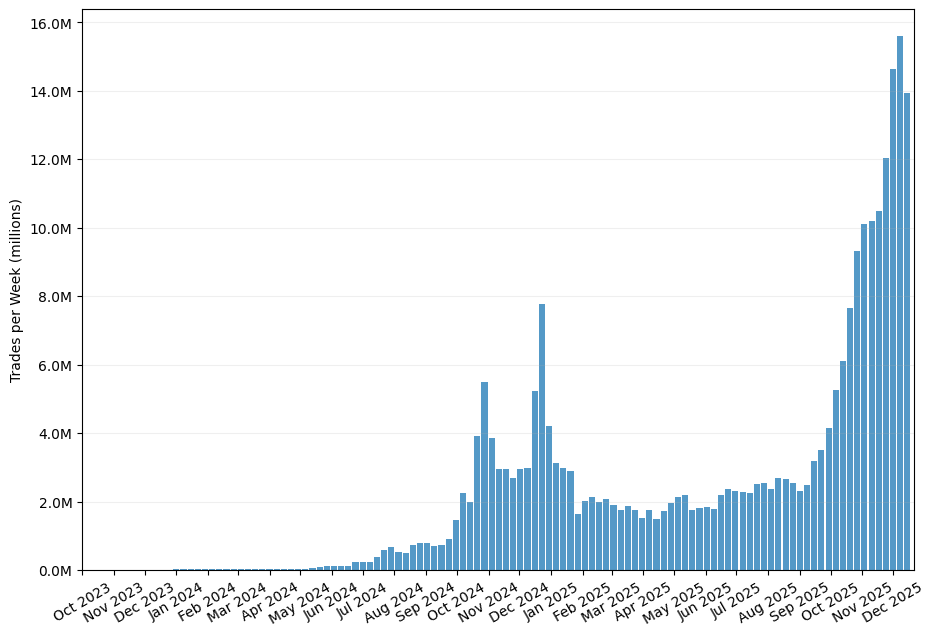
As the available prediction market data is relatively recent (significant liquidity and volume have only appeared in the last three years), the strategy was backtested over six months during a prevailing bull market. This specific window is justified by the structural evolution of the dataset. As illustrated in the Signal Coverage analysis, a substantial increase in ticker count occurred starting in late 2025. In other words, Polymarket provided us with many more questions regarding tickers, giving us a richer dataset. Before this, the sparsity of markets made the signal more inconsistent. However, the end-of-2025 stabilization reinforces the validity of using this period for performance evaluation.

The strategy significantly outperformed the SPY benchmark, delivering a cumulative return of +15.4% compared to the SPY’s +10%. Crucially, the strategy remained largely uncorrelated with the SPY, with a Pearson correlation of -0.169 to SPY returns.

A comparative analysis of various portfolio construction methods demonstrates that the Long/Short (L/S) 25% Equal-Weighted strategy is fundamentally distinct from traditional factors. While it shares some characteristics with momentum, its forward-looking nature allows it to serve as an “enhanced momentum” signal that captures information before it is fully realized in equity prices.

On this graph, multiple distinct investment strategies are plotted to evaluate where this model stands in comparison to classic benchmarks across the industry. First, it is observable that our strategy’s return profile is structurally different from the SPY benchmark, a Price-to-Earnings (P/E) L/S strategy, and a standard 4-week Momentum L/S strategy. This divergence demonstrates that the model introduces a unique trading angle that is not incorporated into these traditional frameworks.
This unique edge stems from the forward-looking nature of prediction market signals. While a classic momentum strategy relies strictly on lagging and historical price data to capture market trends, this composite signal isolates the capital deployment of highly accurate, specialized forecasters before those expectations are fully manifested in the underlying equity price.
The distribution of market categories provides valuable insight into the types of questions driving the composite signal. Approximately 30% of the monitored questions focus directly on traditional corporate earnings, such as “Will Apple beat earnings in Q4?” However, only a further 30% of these earnings-specific questions are ultimately selected by the filters to inform active trades.

This selective threshold leaves substantial room for specific, alternative KPIs to drive the portfolio’s edge. Examples include tracking micro-level supply chain metrics and operational targets, such as the volume of semi-trucks produced by Tesla within a given quarter.
Robustness
This section validates the optimized parameters for portfolio rebalancing, leg weighting, and signal thresholds. Robustness testing confirms that the Sharpe Ratio is maximized at a 25% bucket size with a weekly rebalancing frequency, achieving a ratio of 1.68, but also does not immediately become unprofitable at similar bucket sizes.
The rebalancing frequency analysis reveals that the signal is inherently short-term. Both profitability and the Sharpe Ratio diminish as the rebalancing window extends to biweekly or monthly intervals. This suggests that the informational edge provided by prediction markets decays quickly, and a higher rebalancing frequency is necessary to avoid holding stale positions. By standardizing on a weekly rebalance, the strategy remains responsive to new information while maintaining resilience against execution friction.

Regarding the weekly rebalancing, even when incorporating realistic transaction costs––including actual half-spreads (37 bps) and full spreads (73 bps)––the strategy consistently outperformed the SPY. In a six-month span, the cost-adjusted strategy achieved cumulative returns of approximately 15%, significantly exceeding the benchmark’s performance and proving the strategy’s resilience against execution friction.

We also observed the strategy's rolling beta and correlation to the broader market. The plot reveals that the mean beta reading of -0.03 may have been deceptive, and that the strategy may be more susceptible to market swings than initially anticipated. Interestingly, the sign of both beta and correlation flips from positive to negative in mid-September 2025, at exactly the same time as the beginning of the exponential spike in activity on Polymarket. Our hypothesis is that as prediction markets became better known by the general public versus niche practitioners, Polymarket became yet another vehicle to express upside exuberance common among retail investors, and that informative signal began to come from experienced forecasters betting against consensus rather than setting it.

Conclusion
Consequently, the strategy can be conceptualized as an 'enhanced momentum' framework. It yields a similar upward trajectory compared to a traditional trend-following model during sustained market regimes but provides a structural advantage: by tapping into real-time 'smart money' convictions rather than trailing market metrics, it minimizes lag and reacts more dynamically to shifting information.
Looking forward, the scalability of this strategy is inherently tied to the structural evolution and adoption of decentralized prediction markets. This data dependency introduces a unique dual outlook. On one hand, it presents a clear structural risk: if prediction platforms suffer from liquidity stagnation, regulatory headwinds, or declining user engagement, the underlying signal quality could decay. On the other hand, as prediction markets continue to mature, attract institutional capital, and list an increasingly dense array of micro-economic questions, the signal’s coverage will naturally scale. This expansion will allow the strategy to transition from heavily covered mega-cap equities into less efficient small-cap spaces and highly specialized alternative KPIs, unlocking a deeper and more sustainable pipeline of idiosyncratic alpha.